Context
Engineering leadership runs on a delayed feedback loop. By the time a sprint review reveals a slip, the slip is two weeks old and three downstream decisions have already been made on top of it. Every existing tool — Jira, Linear, ClickUp, GitHub Insights — describes the past. None of them tell a director what is about to break, or what to do about it. The result is a leadership layer that is permanently reactive to its own organisation.
Problem
The signals that predict delivery risk — PR queue ageing, review-time drift, scope creep mid-sprint, ownership concentration on a single file, after-hours spikes — exist in the raw data. They are just spread across two systems, expressed in different vocabularies, and visible to nobody whose job it is to act on them. Worse: the people closest to the signal (engineers) are the people least incentivised to surface it. The result is that risk only becomes visible after it has already cost something.
Approach
PLUTO ingests GitHub and ClickUp into a unified Engineering State Graph — tasks, PRs, commits, people, sprints, repos as nodes; assignments, reviews, dependencies, file ownership as edges. On top of the graph runs a forecasting layer: a single Execution Health score (0–100) with four named dimensions, sprint-completion probability, and a Bottlenecks rank that puts the slowest PRs and longest review queues at the top of the leadership view. Alerts are severity-ranked, evidence-linked, and trained by manual feedback on every dismissal.
System
/ the things actually shipped
- 01
GitHub + ClickUp connectors with webhook-first ingestion and a typed event store — idempotent, deduplicated, schema-versioned.
- 02
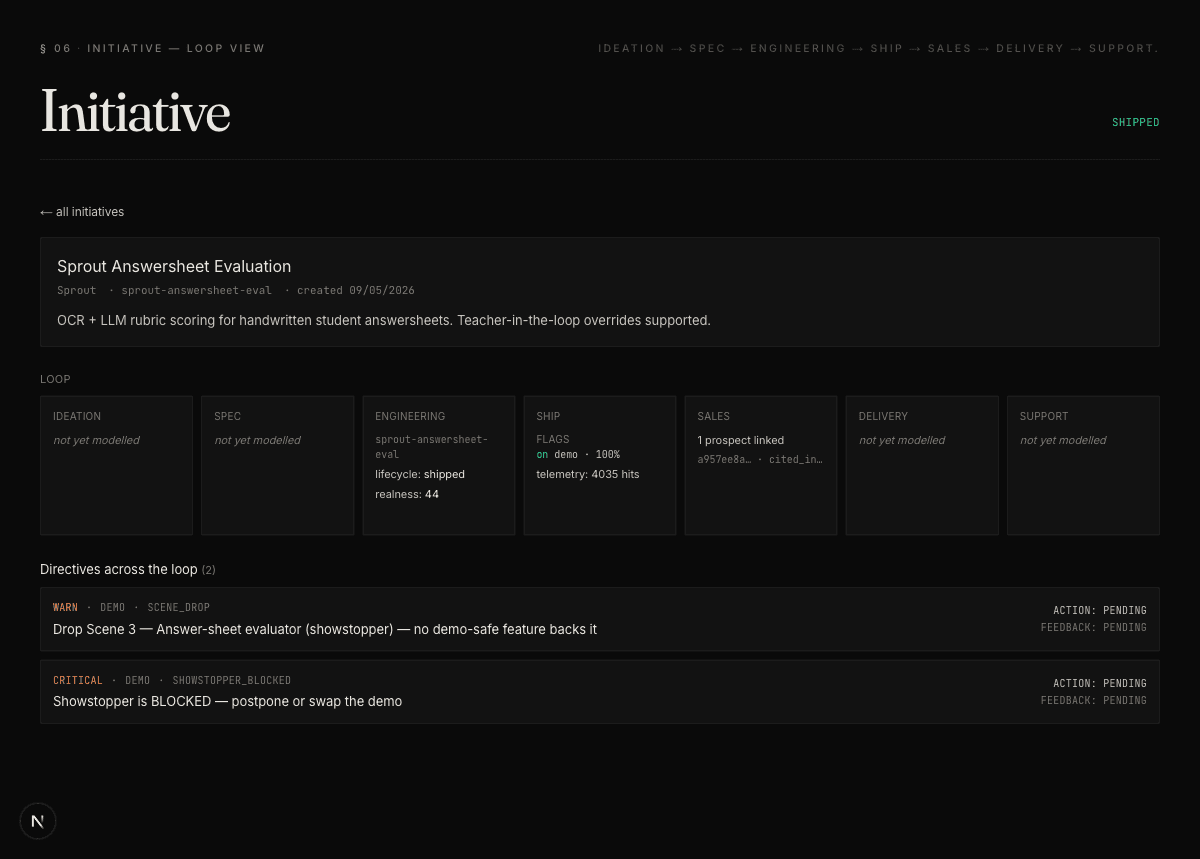
A normalised Engineering State Graph linking task → PR → commit → file → person → sprint. Every edge is queryable, every node is incrementally updated.
- 03
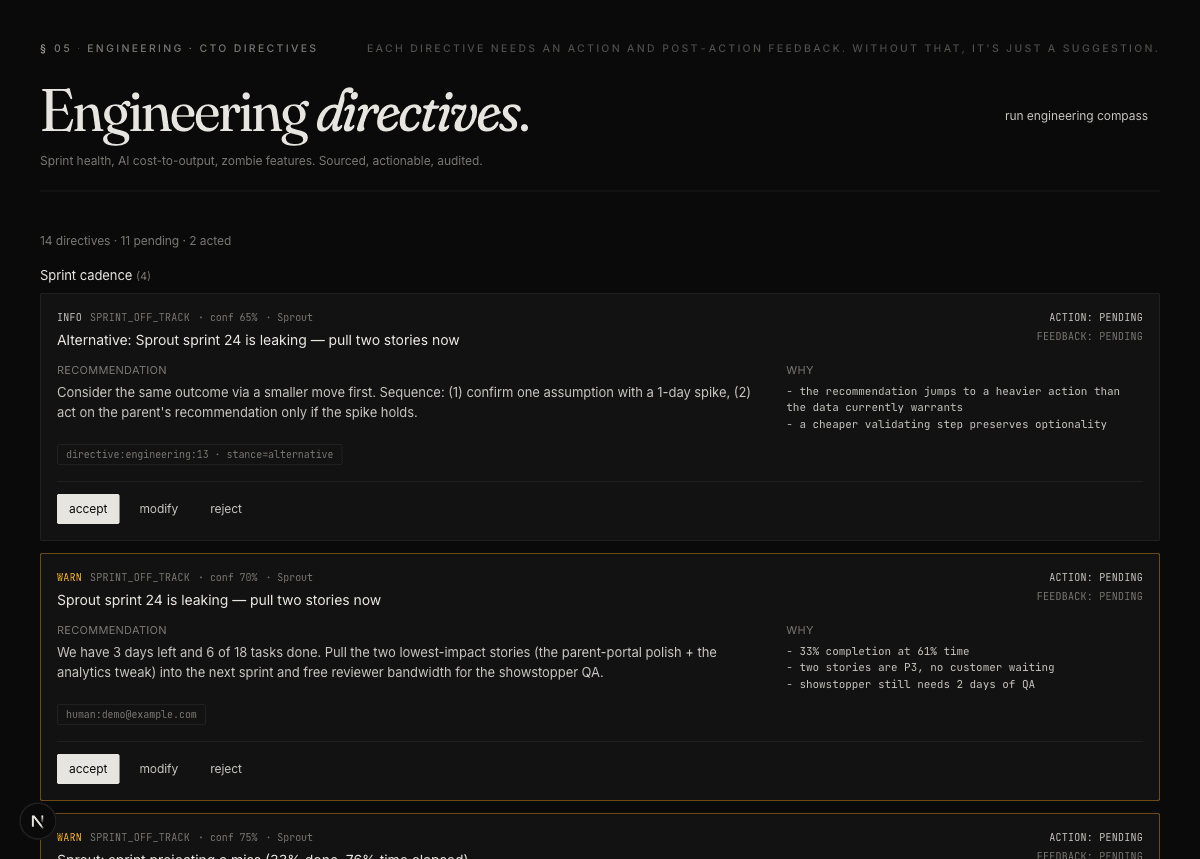
Execution Health score (0–100) decomposed into Code Flow, Planning Stability, Review Efficiency, and Work Distribution — drilldown per team, sprint, repo.
- 04
Sprint Status view with planned-vs-completed, top blockers, and a probability number that updates as the sprint unfolds.
- 05
Bottlenecks panel — slowest PRs, longest reviewer queues, blocked tasks — ranked by time lost, not by chronology.
- 06
Structural Risk heatmap exposing ownership concentration and single-person failure points before they become an incident.
- 07
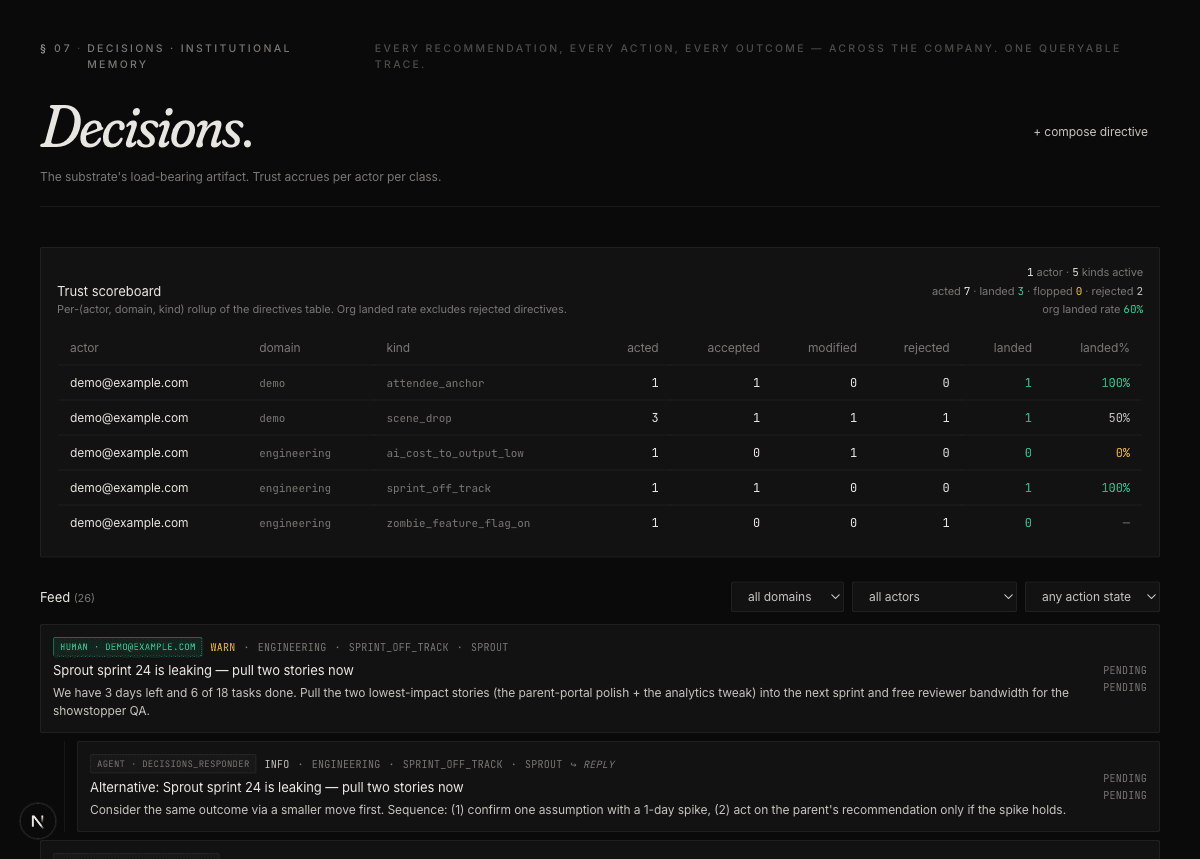
Alert lifecycle (create → acknowledge → resolve) with feedback that trains the model on what counts as a real risk in this organisation.
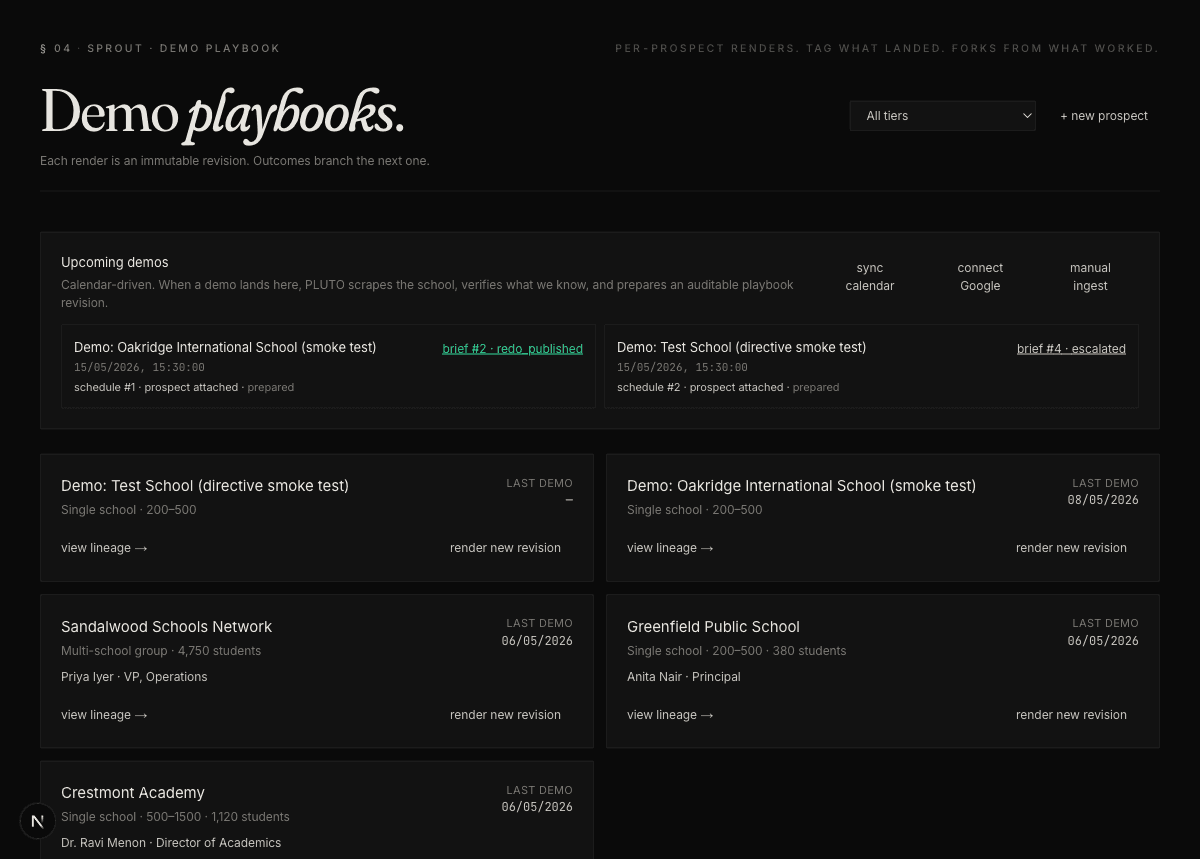
In Practice
Selected views from the system, traced for this case study.
How the pieces fit.
Architecture
- Next.js
- TypeScript
- Recharts
- Five-panel dashboard
- FastAPI
- Pydantic schemas
- Role-aware queries
- Webhook ingress
- Forecast models
- Bayesian sprint probability
- Bottleneck ranking
- Burnout signal detection
- PostgreSQL
- Event store
- Engineering State Graph
- Per-tenant partitioning
- GitHub connector
- ClickUp connector
- Webhook + polling fallback
- Celery workers
- Docker
- Kubernetes (scale path)
- Slack + email alerting
Outcome
Pilot orgs running PLUTO catch at-risk deliverables ~5 days before the deadline, where the previous baseline was the day-of. Median PR review time fell by more than half once the Bottlenecks panel made the longest queues unignorable. Leadership reviews moved from "what happened" to "what are we doing about the three flags on the board" — a different conversation entirely.
Learnings
/ what would be different next time
- /01
A single Execution Health score collapses too much. Four named dimensions ("why is it red?") was the difference between a number leaders ignored and a number they acted on.
- /02
Webhook-first ingestion is the only sane default. Polling is a fallback, never the primary, because the lag destroys the early-warning property.
- /03
Burnout signals are real but politically dangerous. We kept them as a private manager view and never wired them into team-facing dashboards.
- /04
The graph turned out to be more valuable than the dashboards. Half the wins came from one-off queries over the state graph that the prebuilt panels did not anticipate.