Context
Mass education has a compounding problem nobody operates against. A child fails Algebra in Grade 8, paper-passes anyway, and then fails Calculus in Grade 11 because the original foundation was never repaired. Every grade is a downstream surface of every prior gap. The conveyor belt keeps moving. The deficits keep stacking. Teachers see it, parents suspect it, and the institution has no apparatus to fix it because no human can keep up with the volume of gap-closure work that would actually be needed.
Problem
Existing edtech responds to this by building more reporting. Better attendance dashboards, prettier mark sheets, parent portals that render the same lagging numbers in two more colours. None of it operates on the underlying problem, because the operator was never the software — it was always the teacher, and the teacher cannot scale. The result is a category full of scoreboards and no switchboards. What is needed is not another chart. What is needed is something that *acts*, with humans supervising rather than typing.
Approach
Synapse inverts the model. Agents are the operator. Humans are the supervisor. An autonomous swarm continuously diagnoses each student's concept graph, detects compounding deficits, and patches them in real time — generating practice, re-teaching prerequisites, escalating to a human only when the gap is structural or the student is at risk. The product surface is mission control: an override inbox, an autonomy boundary, an agent fleet view, and a single spine metric — *gap-closure events per unit human attention* — that every persona sees a face of.
System
/ the things actually shipped
- 01
Sharp autonomy boundary — agents can change what happens next without permission, but they cannot rewrite what was recorded as having happened, and they cannot communicate externally (parent messages, plagiarism judgements, record mutations) without human approval.
- 02
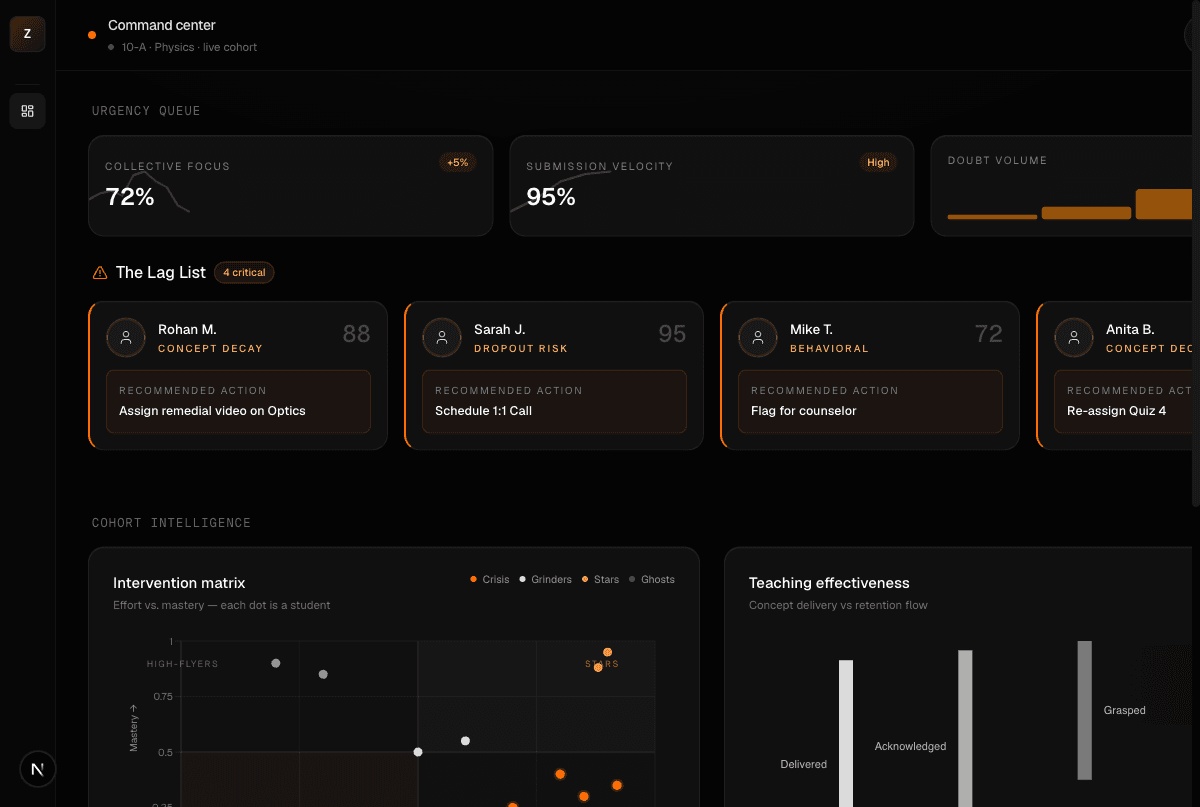
Override inbox as the primary teacher surface — escalations are sorted by structural risk and time-to-compound, not by alphabet or recency. The teacher's job becomes judging the agents' verdicts, not maintaining a gradebook.
- 03
Compound-Deficit-at-Graduation as the headline cohort metric — pre-platform baseline under 5%, product goal above 70%. The number that the entire system optimises toward.
- 04
Curriculum Drift Score — how far the agent swarm has diverged from static NEP / CBSE pacing. Counter-intuitively, the goal is for this number to grow — drift is evidence the agents are responding to the cohort instead of the calendar.
- 05
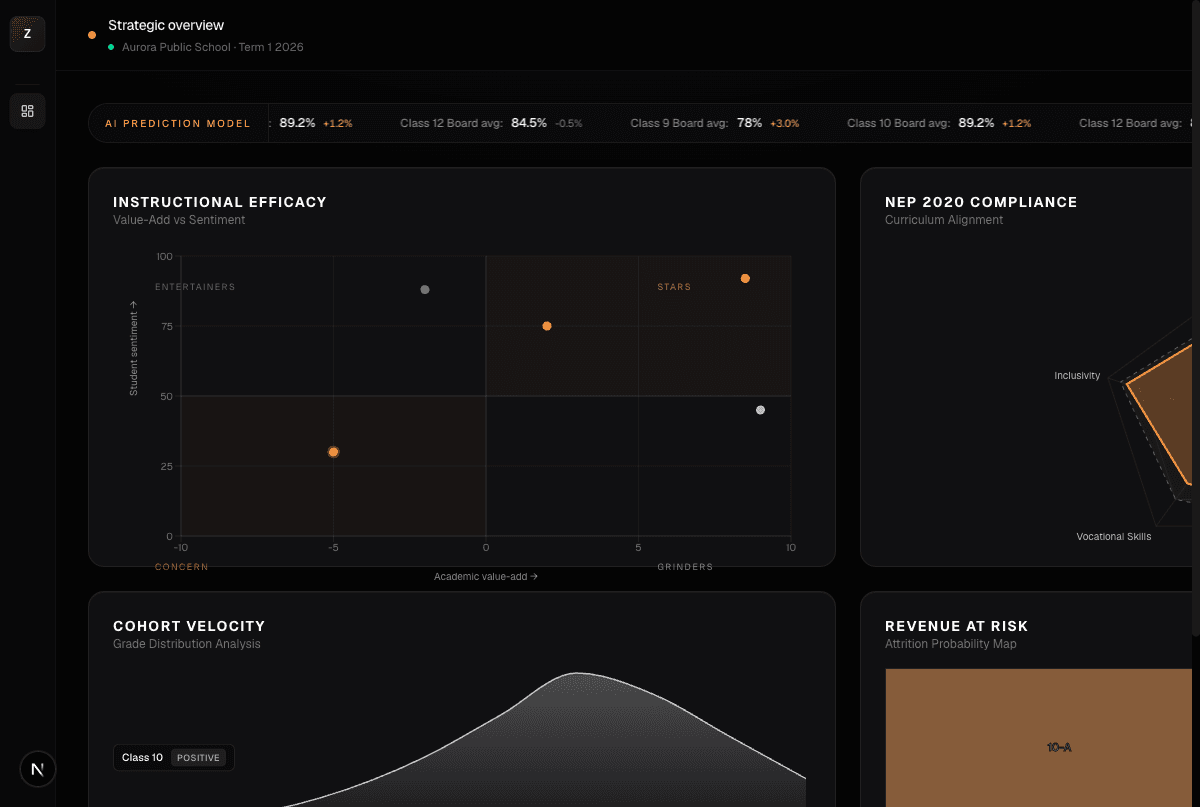
Five operator personas sharing one chrome — Student (Z-cascade quest stack), Parent (editorial verdict), Teacher (asymmetric bento with escalation card), Leader (Compound-Deficit pedestal), Company / Nexus (panopticon view across schools).
- 06
Internal agent telemetry — confidence, calibration error, hallucination rate, and override rate sliced by reason — because the override corpus is how the swarm actually learns.
- 07
Glassmorphic v3 chrome — Geist Sans/Mono on #050505 with ambient radial gradient and SVG noise, real backdrop-blur cards with 1px refraction edge, double-bezel for brand moments — built so the supervision surface feels more cockpit than spreadsheet.
In Practice
Live captures from the shipped product, recorded for this case study.


How the pieces fit.
Architecture
- Next.js App Router
- TypeScript
- Geist Sans / Mono
- Tailwind
- Framer Motion
- Five-persona shell
- Per-student concept-graph workers
- Override-reason classifier
- Hallucination + calibration probes
- Gap-closure events / unit human attention
- Compound-Deficit-at-Graduation
- Curriculum Drift Score
- Concept graph per student
- Override corpus (training data)
- Counterfactual lift log
- Immutable record store
- External-comms approval gate
- Per-tenant isolation
Outcome
Synapse stops looking like school SaaS and starts looking like the substrate underneath it. Teachers stop typing into a gradebook and start ruling on escalations. Leaders stop reading lagging averages and start watching Compound-Deficit-at-Graduation tick down across cohorts. The Trojan horse works because the artefact is a dashboard — but the product is a swarm, and the swarm is what actually moves the number.
Learnings
/ what would be different next time
- /01
Charts are dead weight unless they lead to override, approve, or let-it-run. Every panel had to justify itself against that test, and most early panels failed it.
- /02
Compounding metrics are the moat. The product front-loads Compound-Deficit and Drift Score; point-in-time grades got demoted to drill-downs.
- /03
A sharp autonomy boundary is more product than feature. Agents own the future; humans own the record and the outside world. Without that line, oversight collapses into either rubber-stamping or paralysis.
- /04
Override rate sliced by reason is the single most valuable internal signal — it is the training corpus for the swarm, not just a QA dashboard.